Modulation Index and Deviation
Modulation index is the single number that quantifies how deeply a carrier is modulated — it tells you how much of the carrier's amplitude, frequency, or phase is being changed by the information signal. Get it right and the signal occupies the minimum necessary bandwidth with the maximum recovered audio quality. Get it too low and you waste transmitter power with weak, noisy audio. Get it too high and you violate regulatory bandwidth limits and splatter interference across adjacent channels. This lesson defines modulation index for AM, FM, and PM, shows how each is calculated and measured, explains what over-modulation causes and how it looks on a spectrum analyzer, and introduces the Bessel function sideband table that reveals the full spectral content of an FM signal.
AM Modulation Index
For amplitude modulation, the modulation index m (also called modulation depth or modulation factor) describes what fraction of the carrier amplitude is varied by the audio signal:
m = Vm / Vc
where Vm = peak amplitude of the modulating signal, Vc = unmodulated carrier amplitude
Equivalently, from the envelope:
m = (Emax − Emin) / (Emax + Emin)
where Emax = maximum envelope amplitude, Emin = minimum envelope amplitude
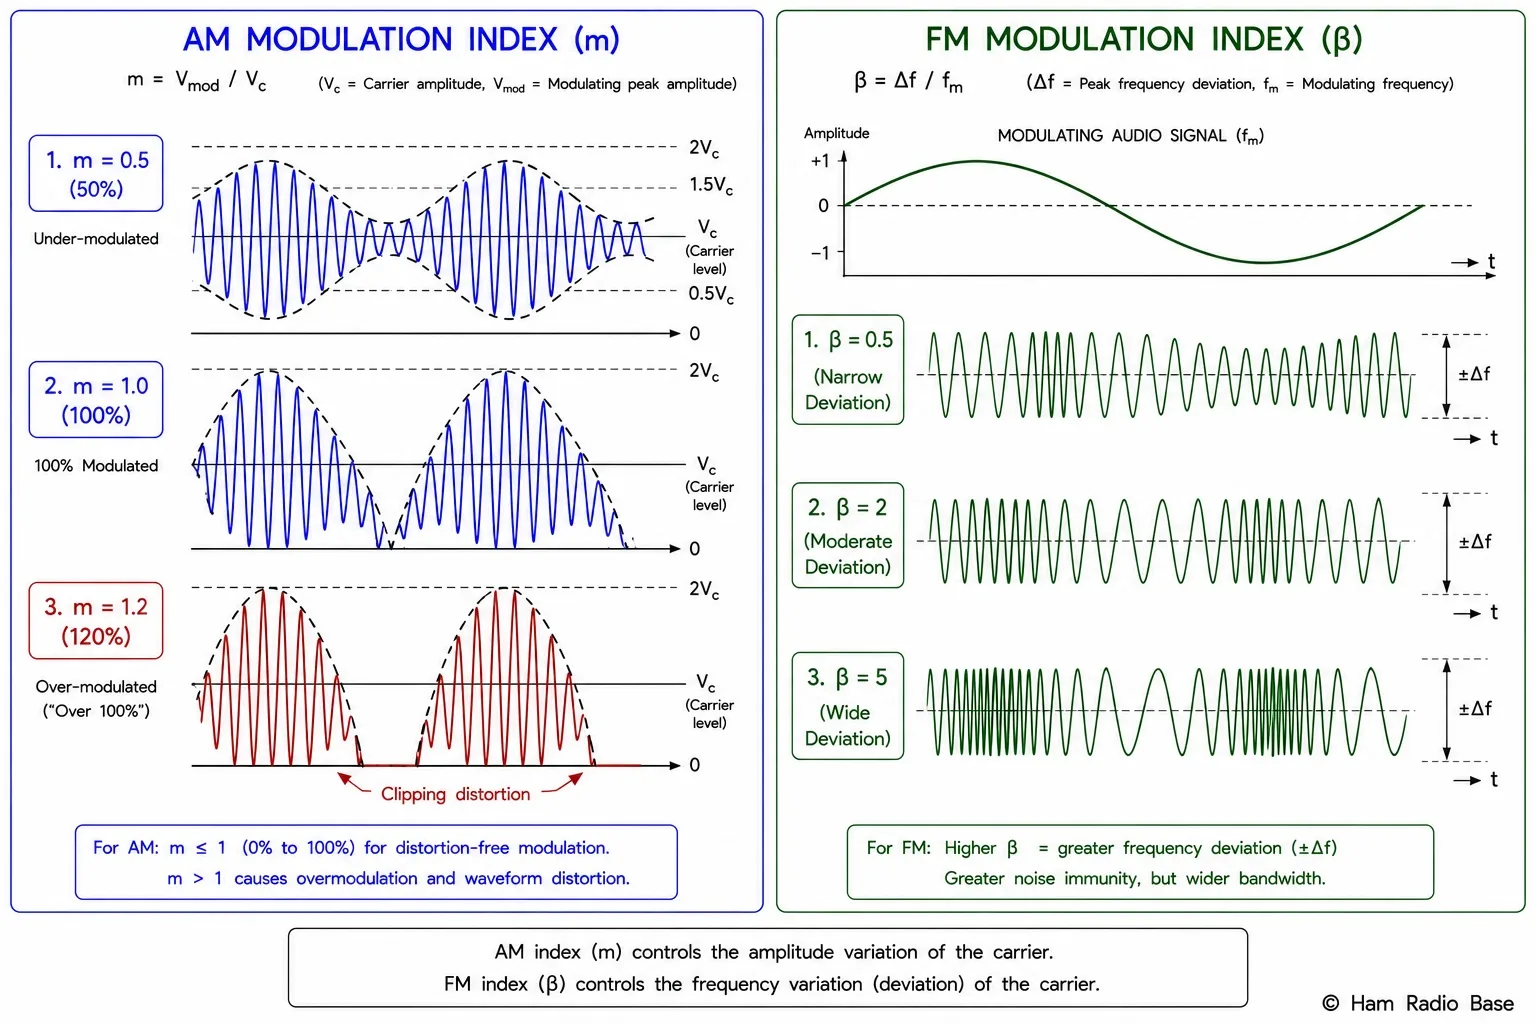
Oscilloscope shows Emax = 150 mV, Emin = 50 mV.
m = (150 − 50) / (150 + 50) = 100 / 200 = 0.5 (50%)
If the audio is turned up so Emax = 200 mV, Emin = 0 mV:
m = (200 − 0) / (200 + 0) = 1.0 (100%) — full modulation
At m = 1.0 (100%) the envelope just touches zero on negative audio peaks. This is the maximum permissible modulation for DSB-FC AM with a linear relationship between modulating signal and carrier amplitude. The efficiency of AM transmission (ratio of sideband power to total power) at 100% modulation with a sinusoidal tone is:
η = m² / (2 + m²) × 100%
At m = 1.0: η = 1 / (2 + 1) = 33.3%
At m = 0.5: η = 0.25 / 2.25 = 11.1%
The remaining power (66.7% at 100% modulation) is in the carrier component, which carries no information. This fundamental inefficiency is why SSB (which suppresses both the carrier and one sideband) is preferred for voice HF communication.
Over-Modulation
When m > 1.0, the modulating signal drives the envelope below zero — which is physically impossible for a real AM transmitter (amplitude cannot be negative). The transmitter clips the envelope at zero, and the resulting flat-bottomed (or flat-topped) waveform contains sharp corners. Sharp corners in the time domain mean broadband energy in the frequency domain: over-modulation generates high-amplitude harmonic sidebands that splatter across adjacent channels.
- Severe distortion of the recovered audio at the receiver
- Splatter sidebands 5–20 kHz wide, interfering with adjacent channel stations
- Violation of FCC Part 97 (amateur) and Part 73 (broadcast) limits
- Potential damage to transmitter PA from high peak envelope power excursions
FM Modulation Index (Deviation Ratio)
For FM, the modulation index β (also called the deviation ratio when computed at maximum deviation and maximum audio frequency) quantifies how many radians the carrier phase has been shifted by the modulating signal. For a sinusoidal modulating tone of frequency fm:
β = Δf / fm
where Δf = peak frequency deviation, fm = modulating frequency
Deviation ratio (worst case, used for bandwidth calculations):
D = Δfmax / fm,max
NBFM (amateur): Δfmax = 5 kHz, fm,max = 3 kHz → D = 5/3 ≈ 1.67
WBFM (broadcast): Δfmax = 75 kHz, fm,max = 15 kHz → D = 75/15 = 5.0
An FM transmitter is modulated by a 2 kHz tone that causes 10 kHz peak frequency deviation.
β = Δf / fm = 10,000 / 2,000 = 5.0
The same transmitter modulated by a 5 kHz tone with the same audio amplitude:
β = 10,000 / 5,000 = 2.0
(FM keeps Δf constant as fm changes; β therefore changes with tone frequency.)
Bessel Functions and FM Sidebands
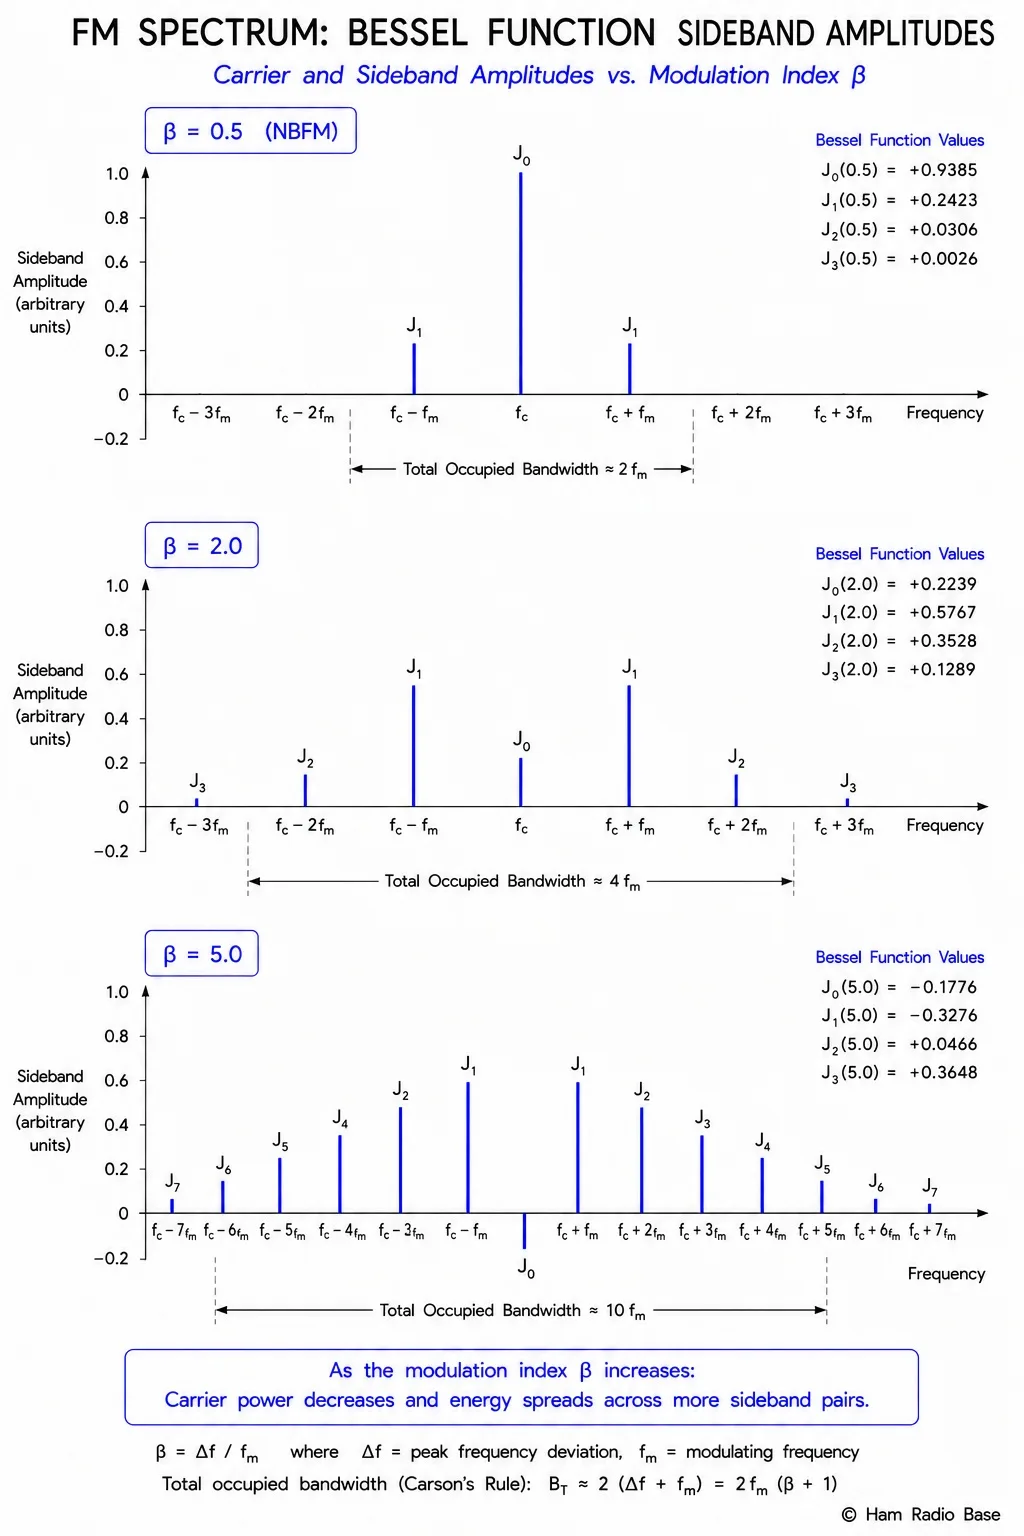
An FM signal modulated by a single tone is mathematically described as an infinite series of sidebands. The amplitude of each sideband is given by the Bessel function of the first kind, Jn(β):
v(t) = Vc [J0(β)cos(2πfct)
+ J1(β)[cos(2π(fc+fm)t) − cos(2π(fc−fm)t)]
+ J2(β)[cos(2π(fc+2fm)t) + cos(2π(fc−2fm)t)]
+ ...]
Jn(β) = amplitude of the n-th sideband pair (Bessel function of the first kind, order n)
| β | J0 (carrier) | J1 | J2 | J3 | J4 | J5 |
|---|---|---|---|---|---|---|
| 0.25 | 0.98 | 0.12 | 0.01 | — | — | — |
| 0.5 | 0.94 | 0.24 | 0.03 | — | — | — |
| 1.0 | 0.77 | 0.44 | 0.11 | 0.02 | — | — |
| 1.5 | 0.51 | 0.56 | 0.23 | 0.06 | 0.01 | — |
| 2.0 | 0.22 | 0.58 | 0.35 | 0.13 | 0.03 | — |
| 2.4 | 0.00 | 0.52 | 0.43 | 0.20 | 0.06 | 0.01 |
| 5.0 | −0.18 | −0.33 | 0.05 | 0.36 | 0.39 | 0.26 |
Key observations from the Bessel table:
- At β = 0 (no modulation), only the carrier exists (J0 = 1, all others zero).
- As β increases, power shifts from the carrier into sidebands — the carrier amplitude decreases.
- At β = 2.4 the carrier completely disappears (J0 = 0). This is the first carrier null.
- The number of significant sidebands grows with β; Carson's rule (BW ≈ 2(Δf + fm)) captures the bandwidth containing 98% of total power.
- Bessel functions can be negative — these sidebands are 180° out of phase with the carrier reference.
PM Modulation Index
For phase modulation, the modulation index equals the peak phase deviation Δφ in radians. When a single sinusoidal tone modulates a PM carrier, the sideband structure is identical in form to FM — Bessel functions apply — but the relationship to audio frequency is different:
βPM = Δφ (peak phase deviation in radians)
This is constant regardless of modulating frequency (unlike FM where β = Δf/fm decreases as fm increases at fixed deviation).
Because βPM is constant with frequency for a fixed-amplitude modulating signal, the PM sideband amplitudes do not change as you sweep the audio tone. In FM, increasing the tone frequency reduces β (at fixed deviation) and therefore changes the sideband structure. This difference — PM has fixed sideband structure with audio frequency, FM has changing sideband structure — is detectable with a spectrum analyzer and is one way to distinguish PM from FM in practice.
Comparing AM, FM, and PM Indices
| Property | AM (μ or m) | FM (β) | PM (βPM) |
|---|---|---|---|
| Definition | Vm / Vc | Δf / fm | Δφ (radians) |
| Units | Dimensionless (0 to 1) | Dimensionless (>0) | Radians (>0) |
| Maximum value (legal) | 1.0 (100%) | No explicit limit; bandwidth must fit channel | No explicit limit; bandwidth must fit channel |
| Effect of increasing audio amplitude | m increases | β increases (Δf increases) | βPM increases (Δφ increases) |
| Effect of increasing audio frequency (same amplitude) | No effect on m | β decreases (Δf stays constant) | No effect on βPM (Δφ stays constant) |
| Over-modulation consequence | Envelope clipping, splatter | Excessive bandwidth, adjacent channel interference | Excessive bandwidth, adjacent channel interference |
Frequently Asked Questions
Why does the carrier disappear at β = 2.4 in FM?
The carrier component amplitude in an FM signal is J0(β) — the zero-order Bessel function of the first kind evaluated at β. J0 is a mathematical function that oscillates like a damped cosine: it starts at 1 (when β = 0), decreases as β grows, crosses zero at β ≈ 2.405, goes negative (meaning 180° phase reversal), crosses zero again at β ≈ 5.52, and so on. The carrier null at β = 2.4 is a mathematically exact feature of the FM spectrum — not a coincidence or approximation. At this point all the transmitter power is in the sidebands. This is sometimes used as a calibration check: adjust deviation until the carrier null appears on a spectrum analyzer, then read off the deviation = 2.4 × fm.
What is the difference between modulation index and deviation ratio?
In FM, modulation index β = Δf / fm at any particular audio tone frequency and level. Deviation ratio D = Δfmax / fm,max uses the maximum permissible values of both — the peak deviation allowed by the transmitter and the highest audio frequency in the program material. Deviation ratio is the worst-case modulation index, used for bandwidth calculations in Carson's rule. For WBFM: D = 75 kHz / 15 kHz = 5. For NBFM amateur (5 kHz deviation, 3 kHz audio): D ≈ 1.67. The terms are sometimes used interchangeably in casual use, but they refer to different things.
How do you measure FM deviation in a real transmitter?
Several methods: (1) A deviation meter (FM deviation meter or service monitor) with an FM discriminator directly reads peak deviation in kHz. (2) Bessel null method: modulate with a single audio tone, increase deviation while watching the carrier on a spectrum analyzer — when the carrier disappears (β = 2.405), the deviation equals 2.405 × fm. (3) Stereo pilot tone method (for broadcast): compare the level of the pilot tone to the deviation at known audio levels. For amateur radio, the deviation meter approach is most practical — a service monitor or communications analyzer with FM deviation measurement is the standard bench instrument.
What is the AM efficiency at 75% modulation?
Using the formula η = m² / (2 + m²): at m = 0.75, m² = 0.5625. η = 0.5625 / (2 + 0.5625) = 0.5625 / 2.5625 = 0.219 = 21.9%. Most AM broadcast transmitters operate with average modulation of 80–90% to maximize efficiency while avoiding over-modulation on audio peaks. The efficiency formula applies to a sinusoidal modulating tone — real voice signals have a lower average modulation index relative to peaks (the crest factor issue), so a speech-modulated transmitter is somewhat less efficient than the formula suggests for a pure tone at the same average level.
Does Carson's rule always give the correct FM bandwidth?
Carson's rule (BW = 2(Δf + fm)) is an engineering approximation that captures about 98% of total FM signal power. It is accurate enough for channel planning and filter design but is not exact. The exact bandwidth depends on how many Bessel sidebands you consider significant (typically down to −40 or −60 dB below the unmodulated carrier). For narrowband FM (β < 0.5), Carson's rule slightly overestimates bandwidth — NBFM bandwidth is often approximated as 2fm alone. For wideband FM (β ≫ 1), Carson's rule simplifies to BW ≈ 2Δf. For intermediate values (0.5 < β < 5), Carson's rule is most useful.
Test Your Knowledge
Answer the questions below to check your understanding of modulation index and deviation.